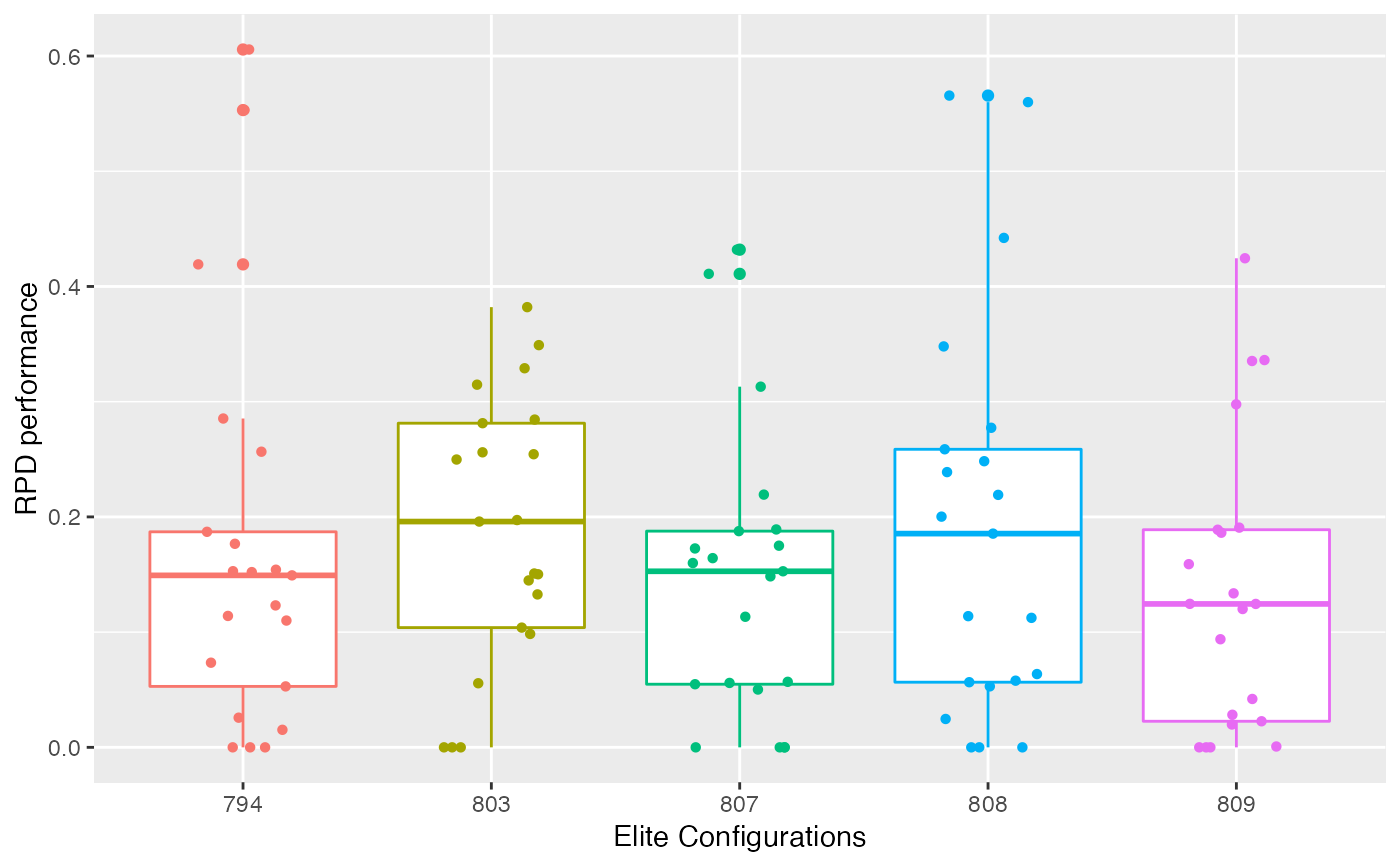
The `boxplot_training` function creates a box plot that displays the performance of a set of configurations on the training instances. Performance data is obtained from the evaluations performed by irace during the execution process. This implies that the number of evaluations can differ between configurations.
boxplot_training(
  irace_results,
  iteration = NULL,
  id_configurations = NULL,
  rpd = TRUE,
  file_name = NULL
)
Arguments
| irace_results | The data generated when loading the |
|---|---|
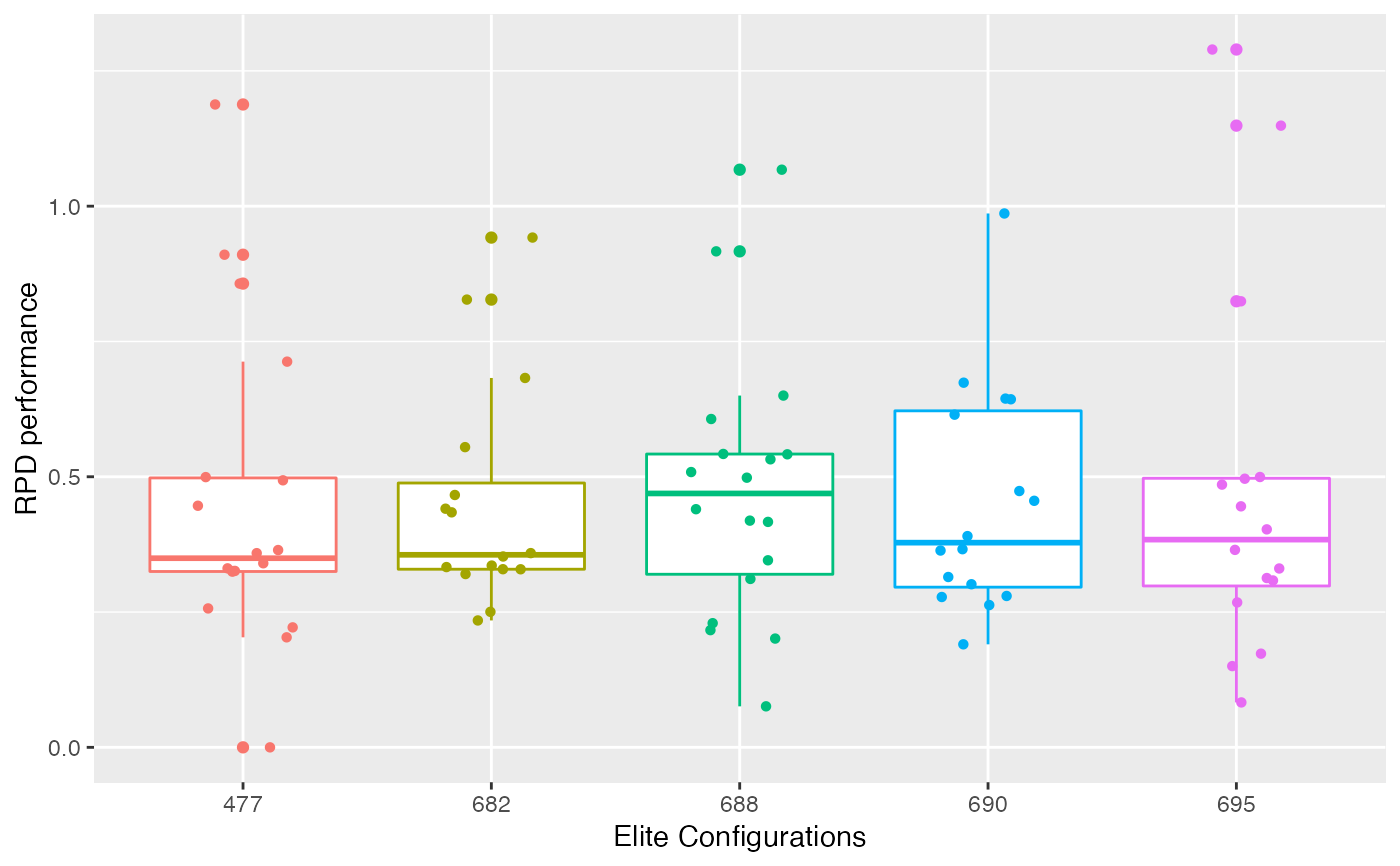
| iteration | Numeric, iteration number that should be included in the plot (example: iteration = 5) When no iteration and no id_condigurations are provided, the iterations is assumed to be the last one performed by irace. The performance data is obtained from the evaluations performed by irace during the execution process. This implies that the number of evaluations can differ between configurations due to the elimination process applied by irace. This plot, consequently, does not provide a complete compaarison of two configurations, for a fair comparison use the test data plot. |
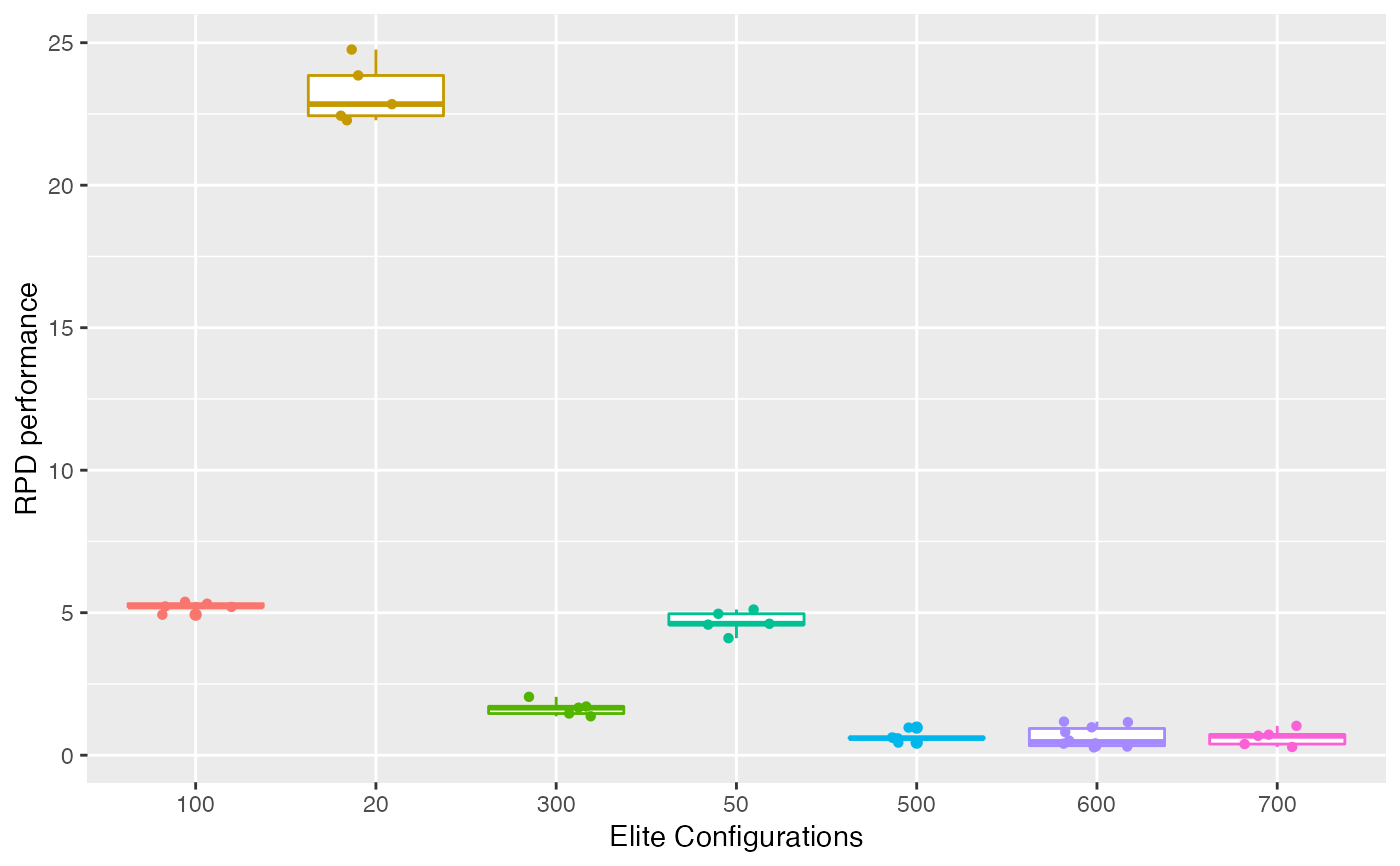
| id_configurations | Numeric vector, configurations ids whose performance should be included in the plot. If no ids are provided, the configurations ids are set as the elite configuration ids of the selected iteration (last iteration by default) (example: id_configurations = c(20,50,100,300,500,600,700)). |
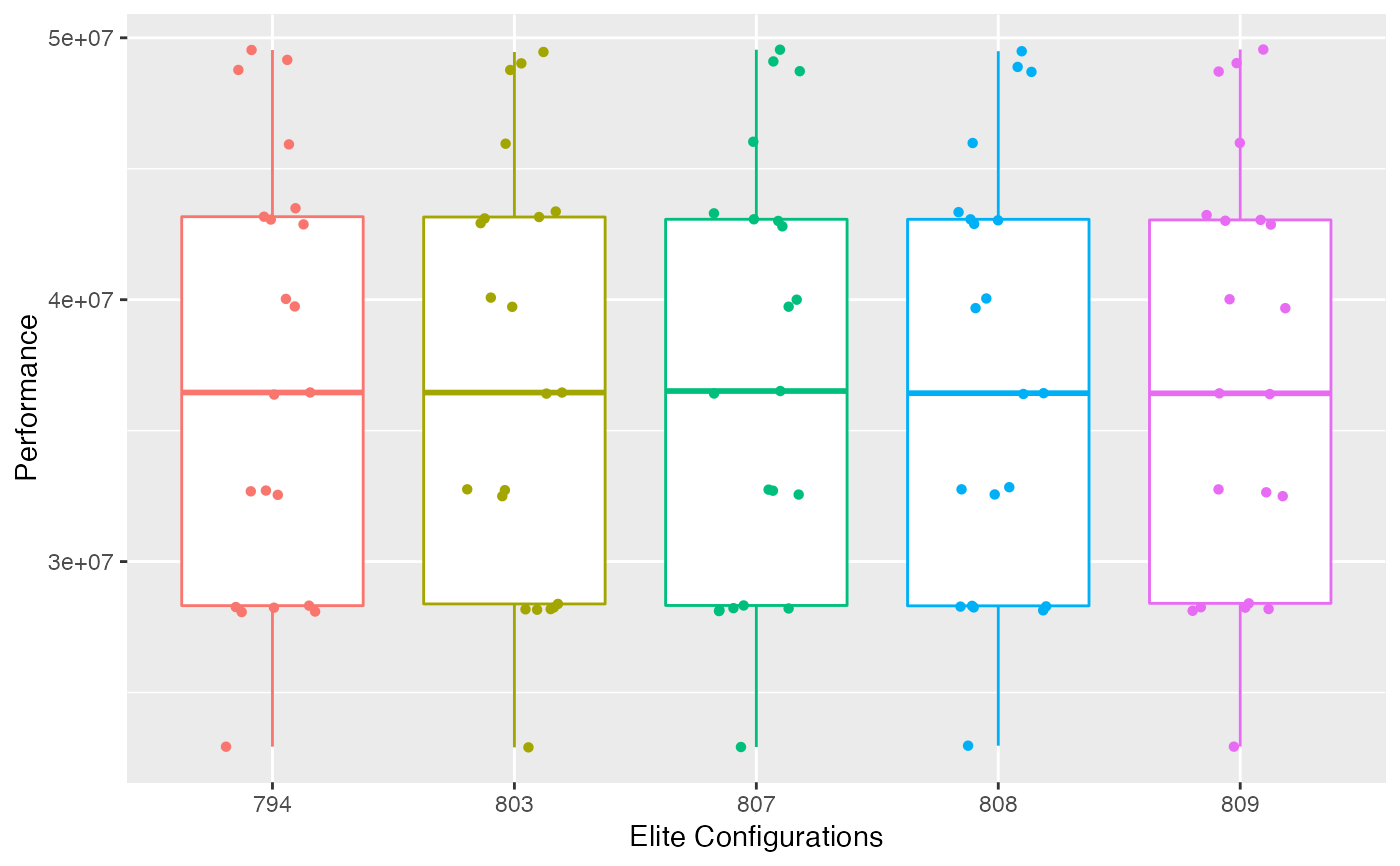
| rpd | Logical (default TRUE), TRUE to plot performance as the relative percentage deviation to best results per instance, FALSE to plot raw performance. |
| file_name | String, file name to save plot (example: "~/patch/example/file_name.png") |
Value
box plot
Examples
boxplot_training(iraceResults)boxplot_training(iraceResults, rpd = FALSE)boxplot_training(iraceResults, iteration = 5)