Frequency and Density plot based on its iteration
Source:R/sampling_frequency_iteration.R
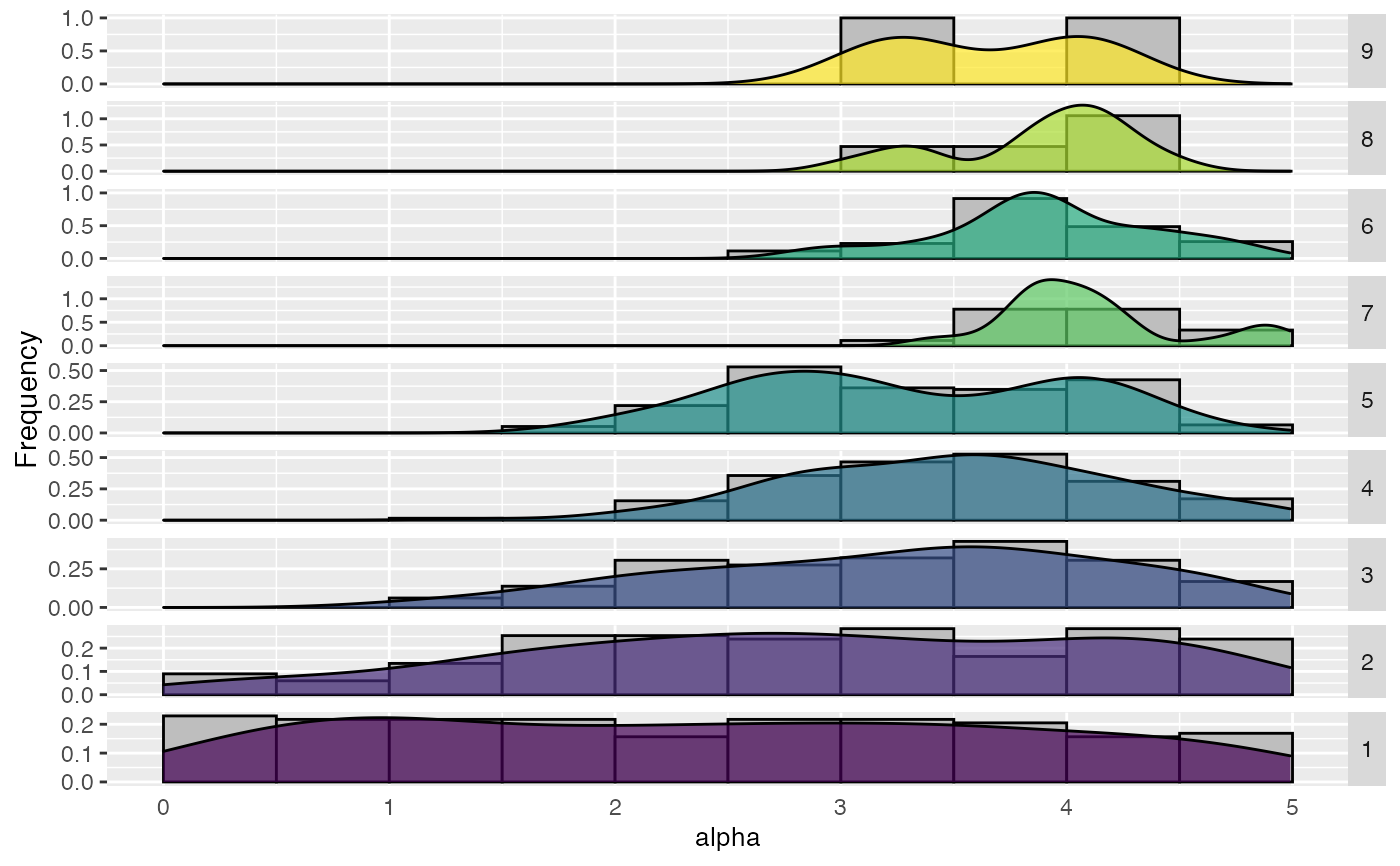
sampling_frequency_iteration.RdThe function will return a frequency plot used for categorical data (its values are string, show a bar plot) or numeric data (show a histogram and density plot) by each iteration
sampling_frequency_iteration(
  irace_results,
  param_name,
  numerical_type = "both",
  file_name = NULL
)
Arguments
| irace_results | The data generated when loading the |
|---|---|
| param_name | String, name of the parameter to be included (example: param_name = "algorithm") |
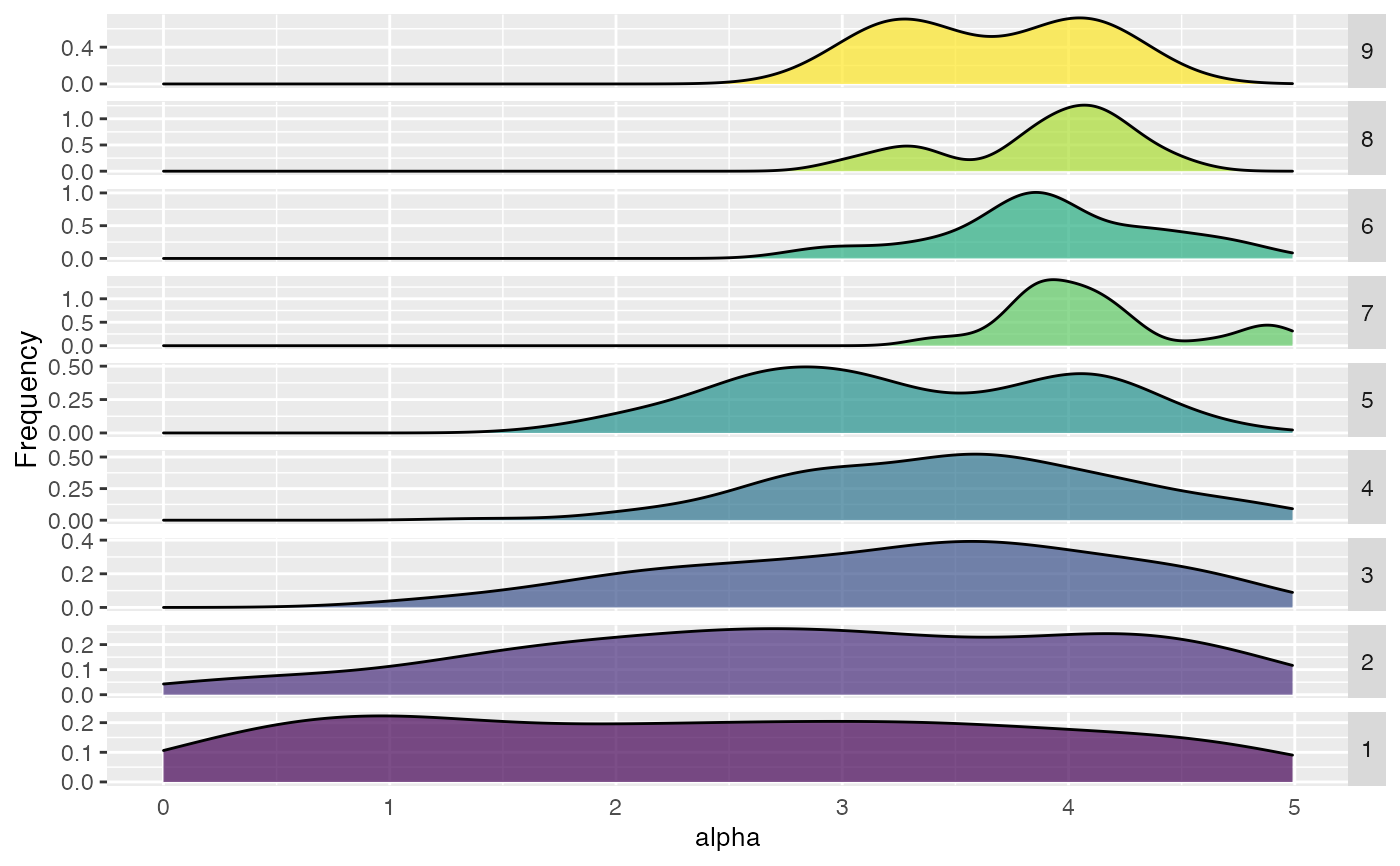
| numerical_type | String, (default "both") Indicates the type of plot to be displayed for numerical parameters. "density" shows a density plot, "frequency" shows a frequency plot and "both" show both frequency and density. |
| file_name | String, file name to save plot (example: "~/path/to/file_name.png") |
Value
Frequency and/or density plot
Examples
sampling_frequency_iteration(iraceResults, param_name = "alpha")sampling_frequency_iteration(iraceResults, param_name = "alpha", numerical_type="density")