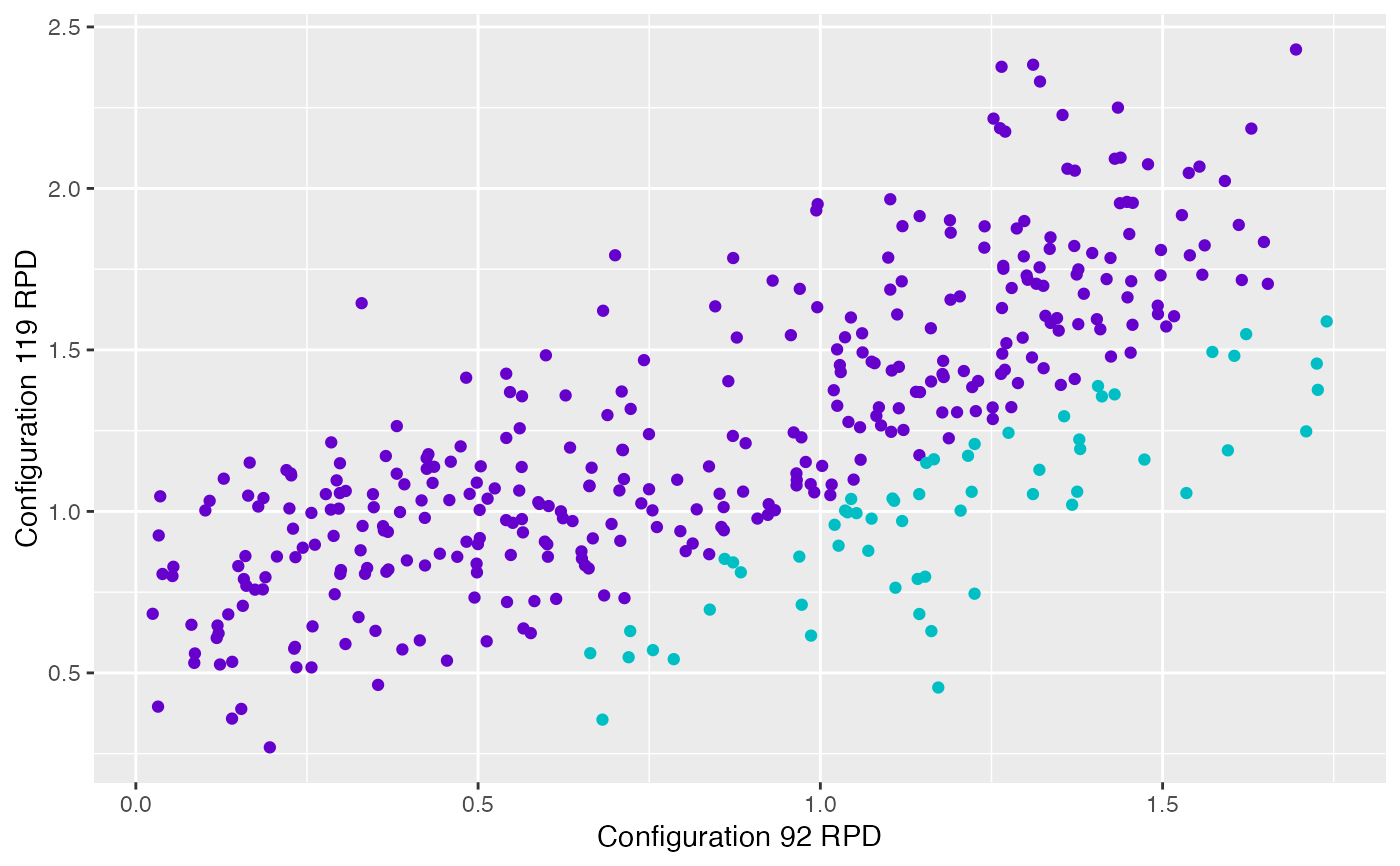
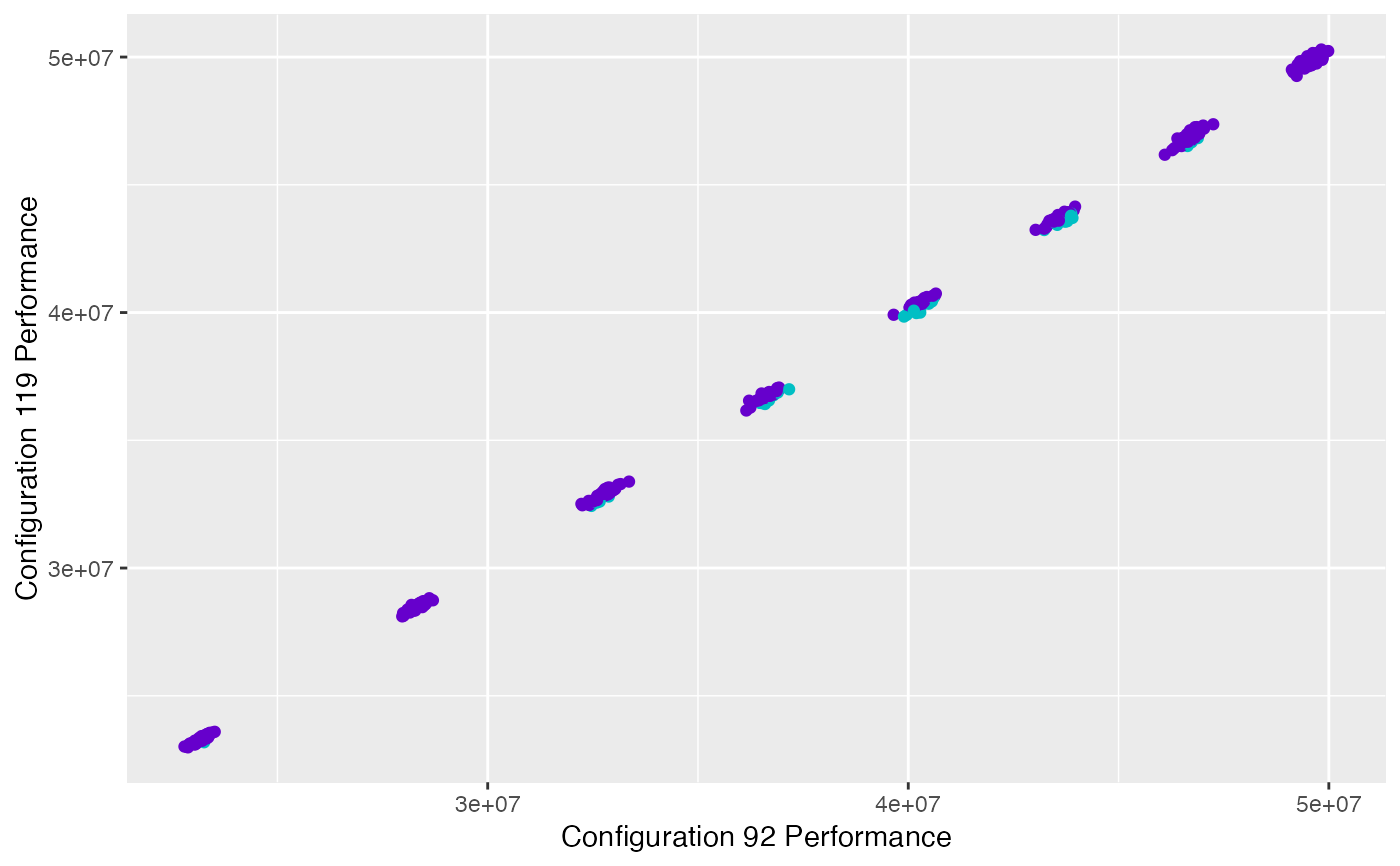
The function creates a scatter plot comparing the performance of two configurations in the test instances. Each point in the plot represents an instance and the color of the points indicates if one configuration is better than the other.
The performance data is obtained from the test evaluations performed by irace. Note that the testing is not a default feature in irace and should be enabled in the setup.
Configuration ids provided in `id_configurations` should belong to elite configuration set evaluated in the test (see the irace package user guide for more details).
scatter_test(
  irace_results,
  id_configurations,
  rpd = TRUE,
  file_name = NULL,
  .interactive = interactive()
)
Arguments
| irace_results | The data generated when loading the |
|---|---|
| id_configurations | String vector, configuration ids whose performance should be displayed (example: id_configurations = c("92","119")) |
| rpd | logical(default TRUE) TRUE to plot performance as the relative percentage deviation to best results per instance, FALSE to plot raw performance |
| file_name | String, File name to save plot (example: "~/patch/example/file_name.png") |
| .interactive | Logical (Default interactive()), TRUE if the plot is generated interactively (plotly package), or FALSE if it should be generated statically. The interactive plot version allows to visualize the instance and exact values of each plot. |
Value
scatter plot