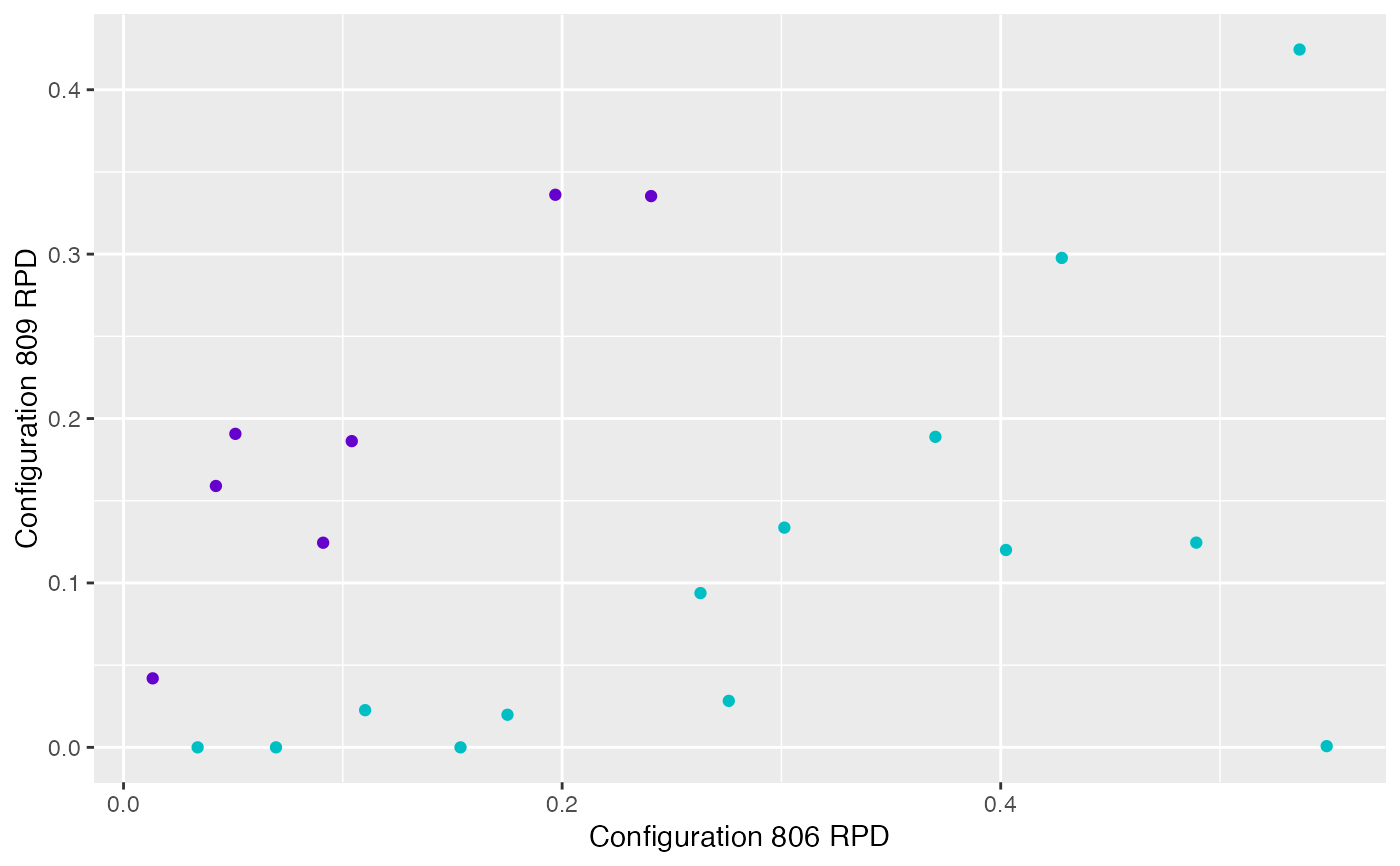
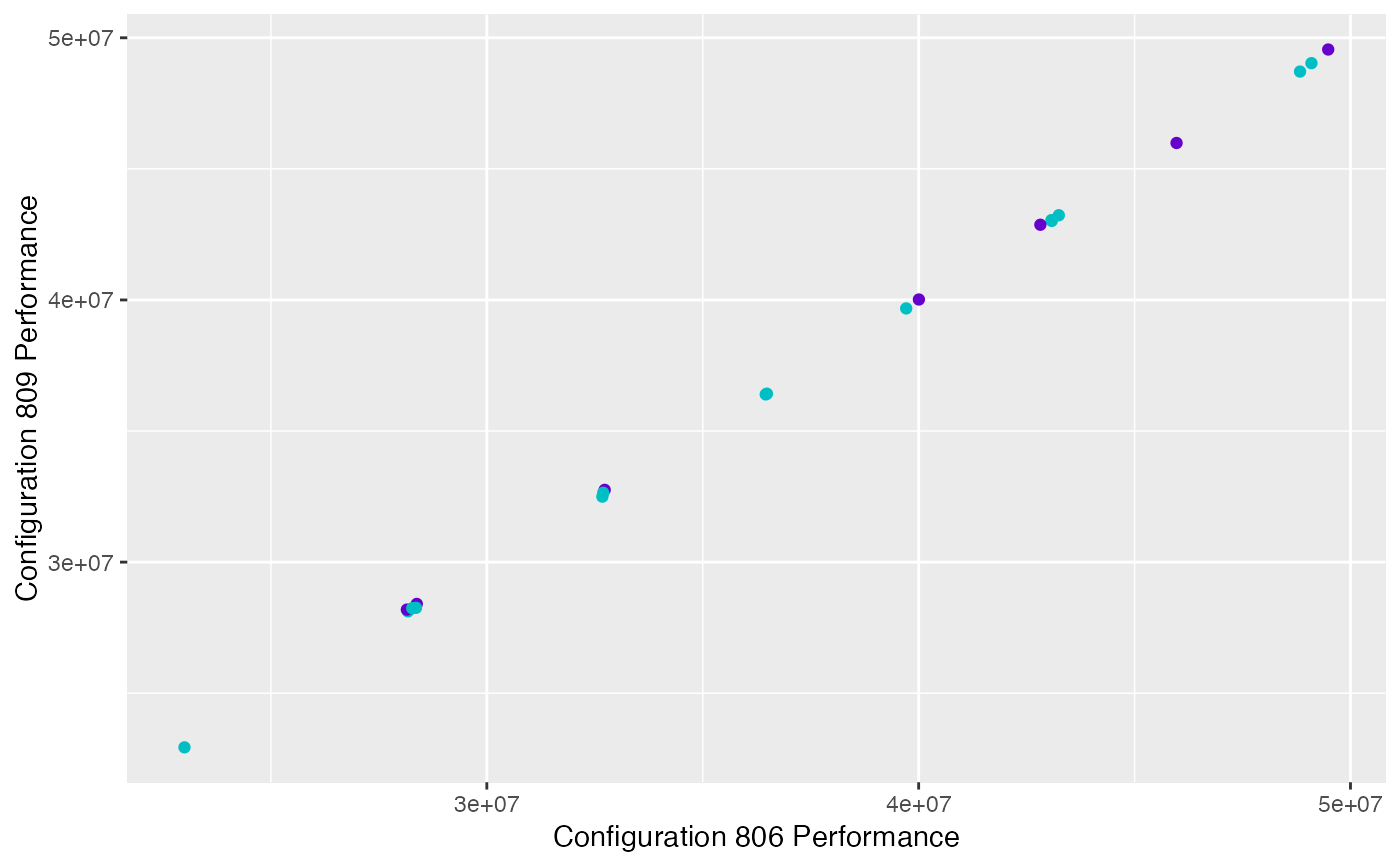
The function creates a scatter plot that displays the performance of two configurations on the training performance. Each point in the plot represents an instance and the color of the points indicates if one configuration is better than the other.
The performance data is obtained from the evaluations performed by irace during the execution process, consequently the number of evaluations can differ between configurations due to the elimination process applied by irace. This plot only shows performance data only for instances in which both configurations are executed.
scatter_training(
  irace_results,
  id_configurations,
  rpd = TRUE,
  file_name = NULL,
  .interactive = interactive()
)
Arguments
| irace_results | The data generated when loading the |
|---|---|
| id_configurations | Numeric vector, configuration ids whose performance should be displayed (example: id_configurations = c("92","119")) |
| rpd | logical(default TRUE) TRUE to plot performance as the relative percentage deviation to best results per instance, FALSE to plot raw performance |
| file_name | String, File name to save plot (example: "~/patch/example/file_name.png") |
| .interactive | Logical (Default interactive()), TRUE if the plot is generated interactively (plotly package), or FALSE it should be generated statically. |
Value
scatter plot